

What Unsupervised Learning Actually Is
Artificial intelligence has transformed how organisations analyse data, automate decisions, and uncover valuable insights. However, one challenge remains consistent across nearly every industry: most real-world data is unlabeled.
- What Unsupervised Learning Actually Is
- What Is Unsupervised Learning?
- Why Unsupervised Learning Matters
- How Unsupervised Learning Works
- Step 1: Collect the Data
- Step 2: Clean and Prepare the Data
- Step 3: Convert Data into Features
- Step 4: Measure Similarity Between Data Points
- Euclidean Distance
- Manhattan Distance
- Cosine Similarity
- Jaccard Similarity
- Step 5: Discover Hidden Patterns
- Step 6: Form Clusters or Representations
- Clusters
- Reduced Dimensions
- Latent Representations
- Step 7: Evaluate the Results
- Why Distance Metrics Matter
- Types of Unsupervised Learning
- 1. Clustering
- How Clustering Works
- Real-World Applications of Clustering
- Customer Segmentation
- Recommendation Systems
- Image Organisation
- Healthcare
- Social Network Analysis
- Popular Clustering Algorithms
- Advantages of Clustering
- Limitations of Clustering
- 2. Dimensionality Reduction
- Understanding the Curse of Dimensionality
- Principal Component Analysis (PCA)
- t-SNE (t-Distributed Stochastic Neighbor Embedding)
- UMAP (Uniform Manifold Approximation and Projection)
- Applications of Dimensionality Reduction
- Data Visualisation
- Noise Reduction
- Faster Machine Learning
- Feature Engineering
- Compression
- 3. Association Rule Learning
- How Association Rules Work
- Key Metrics
- Support
- Confidence
- Lift
- Applications of Association Rule Learning
- 4. Anomaly Detection
- How Anomaly Detection Works
- Common Anomaly Detection Algorithms
- Isolation Forest
- Local Outlier Factor (LOF)
- One-Class Support Vector Machine
- DBSCAN
- Real-World Applications of Anomaly Detection
- Advantages of Anomaly Detection
- 5. Feature Learning and Representation Learning
- What Is a Representation?
- Why Representation Learning Matters
- Embeddings
- Latent Space
- Autoencoders
- Applications of Autoencoders
- From Classical Unsupervised Learning to Modern AI
- Major Unsupervised Learning Algorithms
- K-Means Clustering
- Hierarchical Clustering
- DBSCAN (Density-Based Spatial Clustering of Applications with Noise)
- Gaussian Mixture Models (GMM)
- Principal Component Analysis (PCA)
- t-SNE
- UMAP
- Autoencoders
- Real-World Applications of Unsupervised Learning
- Advantages of Unsupervised Learning
- Limitations of Unsupervised Learning
- Unsupervised Learning vs Self-Supervised Learning
- How to Evaluate Unsupervised Learning Models
- The Future of Unsupervised Learning
- 1. How to Choose the Right Unsupervised Learning Algorithm
- 2. K-Means vs DBSCAN vs Hierarchical Clustering
- 3. PCA vs t-SNE vs UMAP
- 4. Practical Python Example
- 5. Real-World Case Study
- Conclusion
- Frequently Asked Questions
- 1. What is unsupervised learning?
- 2. What are the main types of unsupervised learning?
- 3. What is the most popular unsupervised learning algorithm?
- 4. What is the difference between supervised and unsupervised learning?
- 5. Is ChatGPT trained using unsupervised learning?
- 6. What industries use unsupervised learning?
- 7. Why is feature scaling important for clustering?
- 8. Can unsupervised learning detect fraud?
Every day, businesses generate millions of customer interactions, financial transactions, medical records, images, videos, emails, and sensor readings. While this data contains valuable information, very little of it comes with predefined labels that explain what each record represents. Manually labelling such massive datasets is expensive, time-consuming, and often impractical.
This is where unsupervised learning becomes one of the most powerful branches of machine learning.
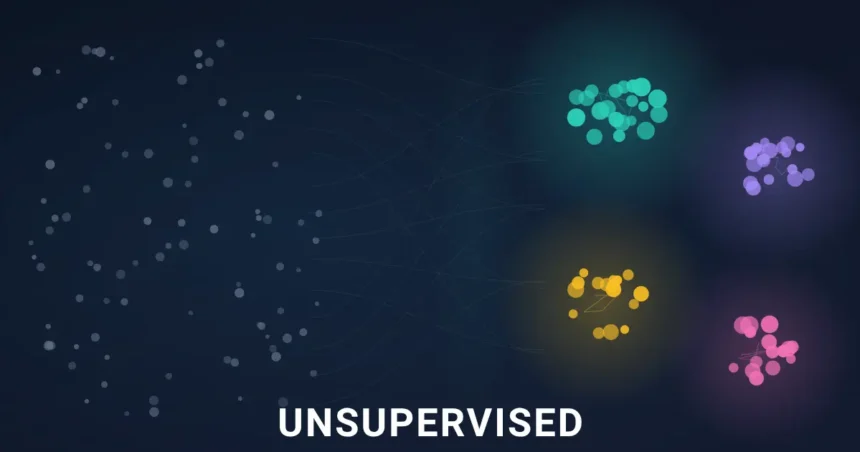
Instead of relying on labelled examples, unsupervised learning allows AI systems to analyse raw data, identify hidden relationships, group similar items together, detect unusual behaviour, and discover patterns that humans may never notice. Rather than being told what to look for, the algorithm explores the data independently and finds its own structure.
Many of the AI-powered experiences people use every day depend on unsupervised learning. Streaming platforms recommend similar movies by identifying patterns in viewing behaviour. Banks detect suspicious transactions by recognising anomalies that differ from normal spending habits. Healthcare researchers discover previously unknown disease subtypes by analysing genetic information, while retailers segment millions of customers into meaningful groups for personalised marketing campaigns.
As organisations continue collecting larger and more complex datasets, the importance of unsupervised learning is growing rapidly. It forms the foundation of modern applications such as recommendation systems, anomaly detection, customer segmentation, feature engineering, scientific research, cybersecurity, natural language processing, and even parts of today’s foundation AI models.
In this comprehensive guide, you’ll learn:
- What unsupervised learning is
- How it works behind the scenes
- The major types of unsupervised learning
- Popular algorithms such as K-Means, DBSCAN, PCA, UMAP, and Autoencoders
- Real-world applications across industries
- Advantages and limitations
- How to evaluate clustering quality
- The differences between unsupervised, supervised, and self-supervised learning
- Emerging trends shaping the future of machine learning
Whether you’re a student, AI enthusiast, data scientist, software developer, or business leader, this guide will give you a practical and in-depth understanding of one of the most important concepts in modern artificial intelligence.
What Is Unsupervised Learning?
Unsupervised learning is a type of machine learning in which an algorithm learns from unlabelled data without being provided with predefined answers or target outputs.
Unlike supervised learning, where every training example includes the correct answer, unsupervised learning receives only the input data. Its objective is to discover meaningful patterns, relationships, structures, or hidden groupings on its own.
Rather than answering questions like:
“Is this email spam or not?”
an unsupervised learning algorithm tries to answer questions such as:
- Which emails are similar?
- Are there natural groups within these messages?
- Are there unusual emails that don’t resemble the rest?
- Can the dataset be represented using fewer variables?
This ability to identify structure without human guidance makes unsupervised learning especially valuable when labels are unavailable or prohibitively expensive to create.
A Simple Example
Imagine an online clothing retailer with information about 500,000 customers.
Each customer record includes:
- Age
- Location
- Purchase history
- Favourite brands
- Average spending
- Shopping frequency
- Device used
- Time of purchase
The company does not know which customers belong to categories such as “budget shoppers,” “premium buyers,” or “seasonal customers.”
Instead of manually reviewing half a million records, an unsupervised learning algorithm analyses the data and automatically discovers natural customer segments.
For example, it might identify groups like:
| Cluster | Characteristics |
|---|---|
| Cluster A | Young customers who frequently buy discounted fashion items |
| Cluster B | High-income customers purchasing luxury brands |
| Cluster C | Occasional shoppers active mainly during holiday sales |
| Cluster D | Loyal customers making frequent repeat purchases |
No one told the algorithm these groups existed. It discovered them by identifying similarities within the data.
These insights can then be used to personalise marketing campaigns, improve product recommendations, optimise pricing strategies, and increase customer retention.
Why Is It Called “Unsupervised”?
The term unsupervised refers to the absence of labelled examples during training.
In supervised learning, the algorithm has a “teacher” that provides the correct answers.
For example:
| House Size | Bedrooms | Price |
|---|---|---|
| 1,200 sq ft | 2 | £180,000 |
| 2,000 sq ft | 4 | £350,000 |
Here, the algorithm learns the relationship between house features and the correct price.
In unsupervised learning, only the input features are available:
| House Size | Bedrooms |
|---|---|
| 1,200 sq ft | 2 |
| 2,000 sq ft | 4 |
| 1,600 sq ft | 3 |
The algorithm has no target values. Instead, it searches for meaningful structures, such as identifying neighbourhoods with similar property characteristics or grouping houses into market segments.
Key Characteristics of Unsupervised Learning
Unsupervised learning differs from other machine learning approaches in several important ways:
- It works with unlabelled datasets.
- It discovers hidden structures without predefined categories.
- It identifies similarities between observations.
- It can reduce data complexity while preserving important information.
- It often serves as an exploratory step before predictive modelling.
- It is particularly useful when labelling data is expensive or impossible.
Because the majority of enterprise data lacks labels, unsupervised learning plays a crucial role in extracting value from information that would otherwise remain underutilised.
Why Unsupervised Learning Matters
The rapid growth of digital information has made unsupervised learning more relevant than ever before.
According to industry estimates, organisations generate quintillions of bytes of new data every day, including customer interactions, social media content, IoT sensor readings, financial transactions, images, videos, medical records, and machine logs. Yet only a small fraction of this data is labelled in a way that machine learning models can directly use.
Creating labels often requires domain experts. For example:
- A radiologist must annotate medical images.
- A cybersecurity analyst must identify malicious network activity.
- A legal expert must classify contracts.
- A linguist may need to label language datasets.
This process is expensive, slow, and difficult to scale.
Unsupervised learning addresses this challenge by allowing machines to extract useful information without relying on manually labelled examples.
Discovering Hidden Patterns
One of the greatest strengths of unsupervised learning is its ability to uncover relationships that humans may overlook.
For example, an e-commerce company analysing millions of purchase records might discover that customers who buy home office furniture frequently purchase ergonomic accessories within two weeks. This insight could lead to more effective product bundles and personalised recommendations.
Similarly, a hospital analysing patient data may identify previously unknown disease subtypes based on genetic markers and clinical characteristics, helping researchers develop more targeted treatments.
Supporting Better Business Decisions
Businesses increasingly rely on unsupervised learning to improve decision-making.
Some common use cases include:
- Segmenting customers for personalised marketing
- Identifying unusual financial transactions that may indicate fraud
- Grouping support tickets by topic to improve response times
- Detecting equipment failures before they occur
- Discovering emerging market trends
- Organising large document collections
- Analysing social media conversations to identify common themes
Rather than replacing human expertise, unsupervised learning provides decision-makers with insights that would be difficult or impossible to obtain through manual analysis.
Enabling Modern AI Systems
Many advanced AI technologies depend on unsupervised or closely related representation-learning techniques.
These include:
- Semantic search
- Vector databases
- Recommendation engines
- Image retrieval
- Document clustering
- Large language models
- Embedding generation
- Multimodal AI systems
By learning meaningful representations of data without explicit labels, unsupervised learning has become a foundational component of modern artificial intelligence.
How Unsupervised Learning Works
Unlike supervised learning, where an algorithm learns from labelled examples, unsupervised learning starts with raw, unlabeled data. The model receives no information about the correct output or categories. Instead, it analyses the data to identify hidden structures, similarities, relationships, and patterns.
Think of it as exploring a library where none of the books have titles or genres. Instead of being told which books belong together, you organise them based on similarities such as writing style, vocabulary, length, subject matter, or recurring themes. Eventually, natural groups begin to emerge.
Machine learning algorithms perform a similar task, but on datasets containing thousands or even millions of records.
Although different algorithms use different mathematical approaches, most unsupervised learning systems follow a similar workflow.
Step 1: Collect the Data
The first step is gathering the dataset that the model will analyse.
Depending on the application, this data may come from various sources, including:
- Customer databases
- Website analytics
- Financial transactions
- Medical records
- Social media posts
- Images and videos
- Sensor readings from IoT devices
- Machine logs
- Scientific experiments
Unlike supervised learning, these datasets do not require labels such as “spam,” “fraud,” or “healthy.” The algorithm only receives the raw observations.
For example, an online retailer may collect customer information like:
| Customer ID | Age | Annual Spending | Orders per Month | Favourite Category |
|---|---|---|---|---|
| 1001 | 24 | £1,200 | 5 | Electronics |
| 1002 | 46 | £4,800 | 9 | Luxury Fashion |
| 1003 | 31 | £700 | 2 | Books |
At this stage, there are no predefined customer segments. The algorithm’s job is to discover them.
Step 2: Clean and Prepare the Data
Raw data is rarely ready for machine learning.
Before analysis begins, data scientists typically perform preprocessing tasks such as:
- Removing duplicate records
- Handling missing values
- Correcting inconsistent formats
- Removing irrelevant features
- Normalising numerical values
- Encoding categorical variables
- Detecting obvious data errors
For example, consider customer income:
| Customer | Annual Income |
|---|---|
| A | £18,000 |
| B | £65,000 |
| C | £240,000 |
Meanwhile, another feature such as “Number of Purchases” might range only from 1 to 50.
Without scaling, income would dominate the calculations because its values are much larger.
Many clustering algorithms, especially K-Means, work significantly better after feature scaling.
Common scaling techniques include:
- Min-Max Scaling
- Standardisation (Z-score)
- Robust Scaling
Proper preprocessing often has a greater impact on results than choosing a different algorithm.
Step 3: Convert Data into Features
Machine learning algorithms cannot directly understand concepts such as “customer loyalty” or “shopping behaviour.” Instead, every observation must be represented numerically.
These measurable properties are called features.
For a customer dataset, features may include:
- Age
- Income
- Average order value
- Purchase frequency
- Website visit duration
- Number of product categories purchased
- Days since last purchase
Each customer becomes a point in a multi-dimensional feature space.
For example:
Customer A

Age: 28
Income: 45,000
Orders: 18
Average Spend: 210
becomes:
(28, 45000, 18, 210)If there are 20 features, each customer becomes a point in 20-dimensional space.
Although humans cannot visualise such high-dimensional data, machine learning algorithms can efficiently process it.
Step 4: Measure Similarity Between Data Points
This is one of the most important stages in unsupervised learning.
To determine whether two observations belong together, the algorithm must calculate how similar they are.
This is done using distance or similarity metrics.
Different metrics produce different clustering results, making the choice of metric an important design decision.
Euclidean Distance
Euclidean distance is the most familiar metric.
It measures the straight-line distance between two points.
For two-dimensional data:
Customer A ●

             \
              \
               \
                ● Customer B
The shorter the distance, the more similar the observations.
Euclidean distance works well when:
- Features are continuous
- Clusters are roughly spherical
- Data has been properly scaled
It is commonly used in:
- K-Means
- K-Nearest Neighbours
- Image clustering
Manhattan Distance
Instead of measuring a straight line, Manhattan distance measures movement along horizontal and vertical paths.
Imagine travelling through city streets arranged in a grid.
Instead of walking diagonally across buildings, you travel along roads.
A → → → ↑ ↑ → BThis metric often performs better when:
- Features are sparse
- Data contains outliers
- High-dimensional datasets are involved
Cosine Similarity
Cosine similarity compares the direction of two vectors rather than their absolute distance.
Imagine two arrows.
Even if one arrow is much longer than the other, they are considered similar if both point in the same direction.
This makes cosine similarity extremely useful for:
- Text analysis
- Natural language processing
- Recommendation systems
- Document clustering
- Search engines
- AI embeddings
For example:
Two articles discussing artificial intelligence may contain different word counts but still be highly similar because they use related vocabulary.
Modern semantic search systems often rely on cosine similarity when comparing vector embeddings.
Jaccard Similarity
Jaccard similarity measures overlap between sets.
Suppose two customers purchase products.
Customer A buys:
Laptop
Mouse
Keyboard
Headphones
Customer B buys:
Laptop
Mouse
Monitor
The more shared items they have, the higher their similarity.
Jaccard similarity is widely used for:
- Market basket analysis
- Recommendation systems
- Tag comparison
- Document similarity
- Binary datasets
Step 5: Discover Hidden Patterns
Once similarities have been calculated, the algorithm begins searching for natural structures within the dataset.
Different algorithms look for different kinds of patterns.
For example:
K-Means
Looks for compact groups centred around cluster centroids.
Hierarchical Clustering
Builds a tree showing how observations gradually merge into larger groups.
DBSCAN
Searches for dense regions separated by sparse areas.
Gaussian Mixture Models
Assume that data comes from several overlapping probability distributions.
Autoencoders
Learn compressed representations that preserve important information.
Although these algorithms use different mathematical techniques, they all attempt to answer the same question:
Which observations naturally belong together?
Step 6: Form Clusters or Representations
After analysing similarities, the algorithm generates its final output.
Depending on the method used, this may include:
Clusters
Cluster A
•
•
•
•

Cluster B
•
•
•

Cluster C
•
•
•
Each cluster contains observations sharing similar characteristics.
Reduced Dimensions
Instead of hundreds of variables, the algorithm may compress the dataset into just a few informative features.
For example:
Original dataset
120 Features↓
After PCA
12 Principal ComponentsThis makes visualisation, storage, and downstream machine learning much easier.
Latent Representations
Deep learning methods often convert raw data into compact mathematical representations called embeddings or latent vectors.
These representations capture semantic meaning.
For example:
Cat image
↓

768-dimensional embedding

↓

Similar embeddings

↓

Other cat images
This concept powers:
- Semantic search
- Face recognition
- Recommendation systems
- Large Language Models
- Vector databases
Step 7: Evaluate the Results
One of the biggest challenges in unsupervised learning is determining whether the discovered patterns are actually meaningful.
Unlike supervised learning, there are usually no correct answers to compare against.
Instead, practitioners use techniques such as:
- Silhouette Score
- Davies-Bouldin Index
- Calinski-Harabasz Index
- Cluster visualisation
- Domain expert validation
- Business impact assessment
We’ll examine these evaluation methods in detail later in this guide.
Why Distance Metrics Matter
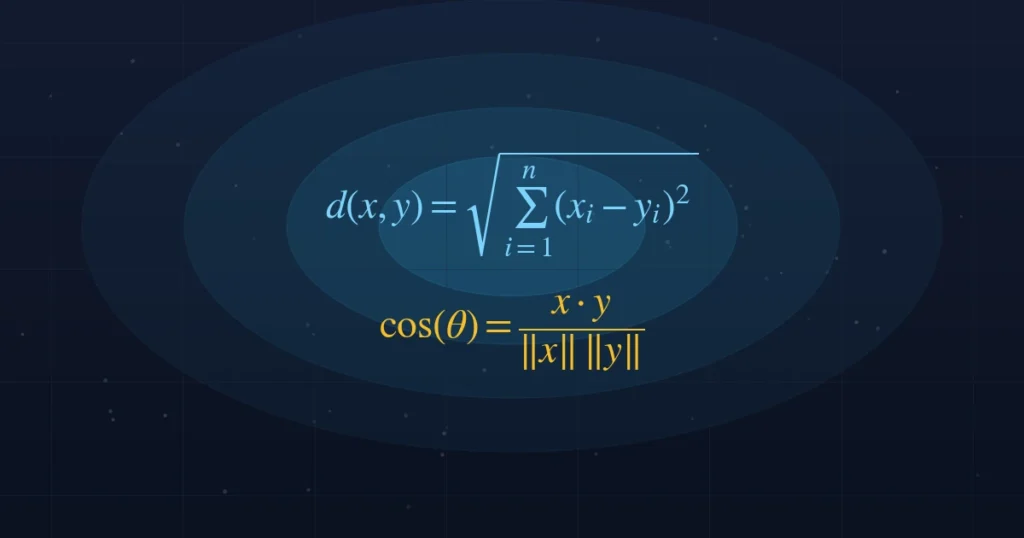
Many beginners assume that choosing a clustering algorithm is the most important decision. In reality, the distance metric can have just as much influence on the final outcome.
Imagine organising a music streaming library.
If similarity is based on genre, rock songs may be grouped together. If similarity is based on tempo, energetic pop songs and fast rock songs might end up in the same cluster. If similarity is based on lyrics, songs with similar themes could be grouped regardless of genre.
The underlying data hasn’t changed—only the way similarity is measured has.
The same principle applies in machine learning. Selecting an inappropriate distance metric can produce clusters that appear mathematically correct but are meaningless in the real world. Choosing the right metric ensures the algorithm captures the relationships that actually matter for your specific problem.
Types of Unsupervised Learning
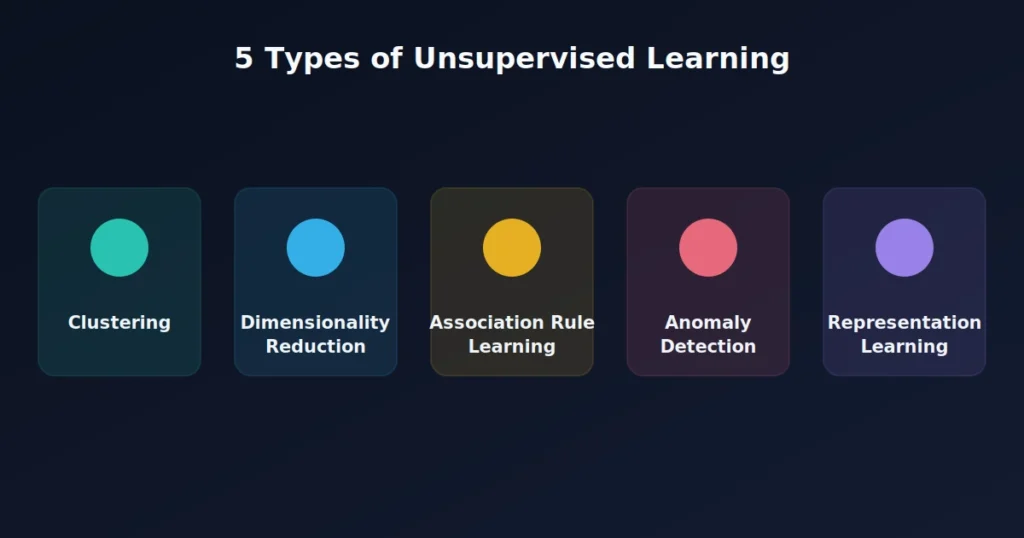
Unsupervised learning is not a single algorithm or technique. Instead, it is a broad category of machine learning methods designed to analyse unlabelled data in different ways.
Some algorithms group similar data points, while others reduce the number of variables, identify unusual observations, discover relationships between events, or learn compact representations of complex data.
Understanding these categories helps you choose the right technique for a specific problem rather than relying on a one-size-fits-all approach.
The five major types of unsupervised learning are:
- Clustering
- Dimensionality Reduction
- Association Rule Learning
- Anomaly Detection
- Feature Learning and Representation Learning
Let’s explore each in detail.
1. Clustering
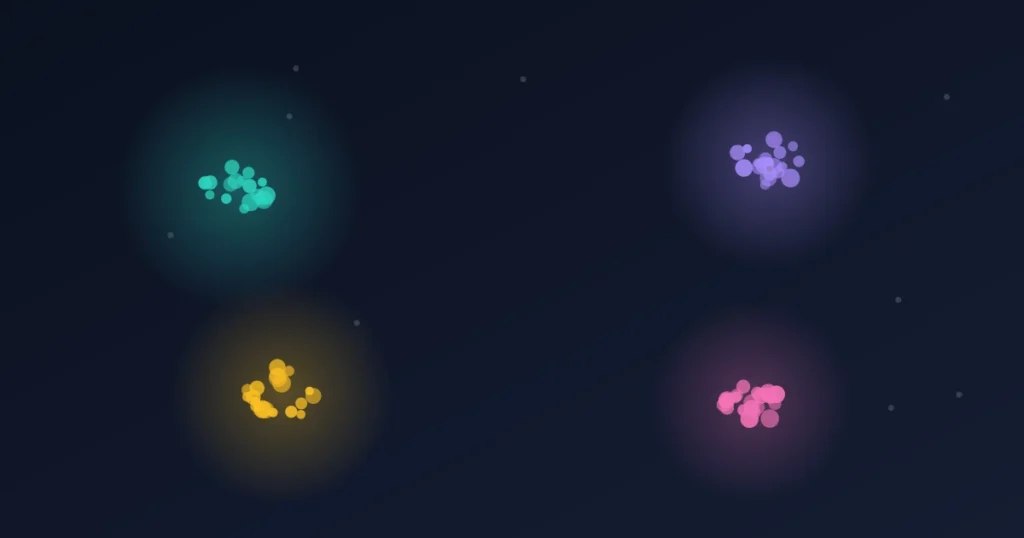
Clustering is the most widely used form of unsupervised learning.
Its goal is simple:
Group similar data points together while keeping dissimilar points in separate groups.
Unlike classification, clustering does not begin with predefined categories. Instead, the algorithm discovers natural groupings based on similarities within the dataset.
Imagine entering a room filled with hundreds of people you have never met. Without anyone introducing them, you might naturally notice that some people are students, some are business professionals, and others are families with children. You are identifying patterns based on observation rather than prior knowledge. Clustering algorithms work in much the same way.
How Clustering Works
Each observation is represented as a point in multidimensional space.
The algorithm compares these points using a similarity measure such as Euclidean distance or cosine similarity.
Points that are close together are grouped into the same cluster.
For example, an online retailer may have customer data like this:
| Customer | Age | Orders per Year | Average Spend |
|---|---|---|---|
| A | 24 | 42 | £35 |
| B | 27 | 39 | £40 |
| C | 61 | 8 | £280 |
| D | 58 | 10 | £310 |
Without any predefined labels, the algorithm may discover two customer groups:
Cluster 1
- Younger customers
- Frequent purchases
- Lower average spending
Cluster 2
- Older customers
- Less frequent purchases
- Higher-value purchases
The business can then tailor promotions for each group without manually analysing thousands of customer records.
Real-World Applications of Clustering
Clustering is used in almost every industry.
Customer Segmentation
Retailers divide customers into groups based on shopping behaviour, purchase frequency, lifetime value, or interests.
Instead of sending identical promotions to every customer, businesses can personalise offers for each segment.
Recommendation Systems
Streaming services and e-commerce platforms identify users with similar preferences.
If two customers consistently purchase similar products, recommendations from one customer can be suggested to the other.
Image Organisation
Photo management applications automatically group similar faces, objects, landscapes, or events without requiring manual tagging.
Healthcare
Hospitals analyse patient records to discover disease subtypes that were previously unknown.
These clusters can help researchers develop more personalised treatments.
Social Network Analysis
Social media platforms identify communities with shared interests, helping improve content recommendations and advertising.
Popular Clustering Algorithms
Several algorithms solve clustering problems in different ways.
The most widely used include:
- K-Means
- Hierarchical Clustering
- DBSCAN
- Gaussian Mixture Models
- Mean Shift
- Spectral Clustering
We’ll explore each algorithm later in this guide.
Advantages of Clustering
- Works without labelled data
- Reveals hidden structures
- Improves customer understanding
- Supports data exploration
- Useful for feature engineering
- Scales to very large datasets
Limitations of Clustering
- Choosing the right number of clusters can be difficult.
- Some algorithms struggle with irregular cluster shapes.
- Results depend heavily on feature scaling.
- Different algorithms may produce different groupings from the same dataset.
- Interpreting clusters often requires domain expertise.
2. Dimensionality Reduction
Modern datasets often contain hundreds or even thousands of features.
For example:
A medical dataset may include:
- Age
- Blood pressure
- Heart rate
- Cholesterol
- Genetic markers
- MRI measurements
- Blood test results
- Lifestyle factors
A genomic dataset may contain tens of thousands of variables.
Working directly with so many features creates several challenges:
- Slower training
- Increased memory usage
- Higher computational costs
- Greater risk of overfitting
- Difficult visualisation
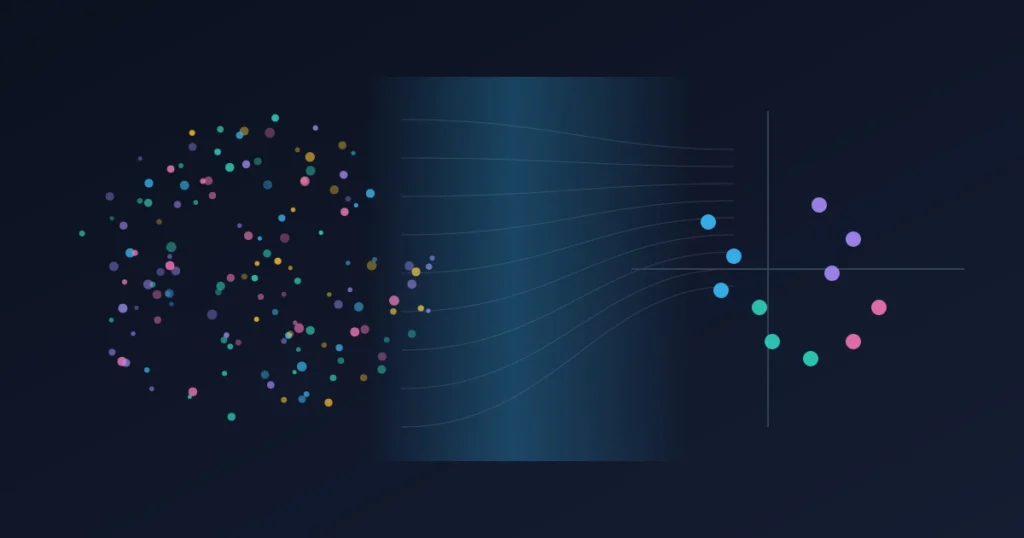
Dimensionality reduction addresses these problems by transforming the data into a smaller set of features while preserving as much useful information as possible.
Understanding the Curse of Dimensionality
As the number of features increases, data points become increasingly sparse.
Distances between observations become less meaningful, making clustering and other machine learning tasks more difficult.
This challenge is known as the curse of dimensionality.
For example:
A dataset with:
- 5 features may work efficiently.
- 50 features becomes more complex.
- 500 features becomes computationally expensive.
- 5,000 features may require specialised techniques.
Dimensionality reduction helps simplify these high-dimensional datasets.
Principal Component Analysis (PCA)
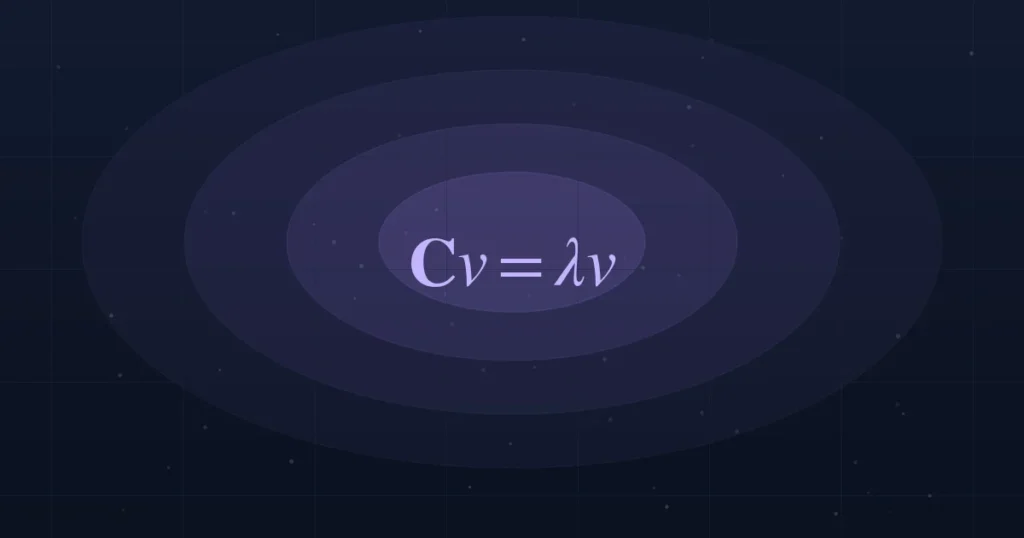
PCA is the most widely used dimensionality reduction algorithm.
Instead of keeping every feature, PCA creates new variables called principal components.
Each principal component captures as much variation in the data as possible.
Imagine photographing a three-dimensional object.
Although the object exists in 3D space, a carefully chosen camera angle can capture most of its important information in a two-dimensional image.
PCA performs a similar transformation mathematically.
For example:
Original features:
- Height
- Weight
- Body fat
- Muscle mass
- Waist size
PCA may compress these into:
- Component 1: Overall body size
- Component 2: Body composition
The dataset becomes much smaller while retaining most of the useful information.
t-SNE (t-Distributed Stochastic Neighbor Embedding)
Unlike PCA, t-SNE is mainly used for visualisation.
It converts high-dimensional datasets into two or three dimensions while preserving local relationships.
Researchers frequently use t-SNE to visualise:
- Word embeddings
- Image datasets
- Gene expression data
- Customer segments
Although excellent for visualisation, t-SNE is generally not used for production machine learning because it can be computationally intensive and does not naturally preserve global structure.
UMAP (Uniform Manifold Approximation and Projection)
UMAP is a more recent dimensionality reduction technique that has become increasingly popular.
Compared with t-SNE, UMAP typically:
- Runs faster
- Scales to larger datasets
- Better preserves both local and global relationships
- Produces more consistent embeddings
Because of these advantages, many modern AI applications use UMAP for data exploration and visualisation.
Applications of Dimensionality Reduction
Dimensionality reduction supports many machine learning workflows.
Common applications include:
Data Visualisation
Reducing hundreds of variables to two dimensions allows researchers to inspect hidden structures visually.
Noise Reduction
Redundant or less informative variables can be removed, improving model performance.
Faster Machine Learning
Smaller datasets require less memory and computational power.
Training times often decrease significantly.
Feature Engineering
The transformed components can be used as input for supervised learning models.
Compression
High-dimensional datasets can be stored more efficiently without losing most of their important information.
3. Association Rule Learning
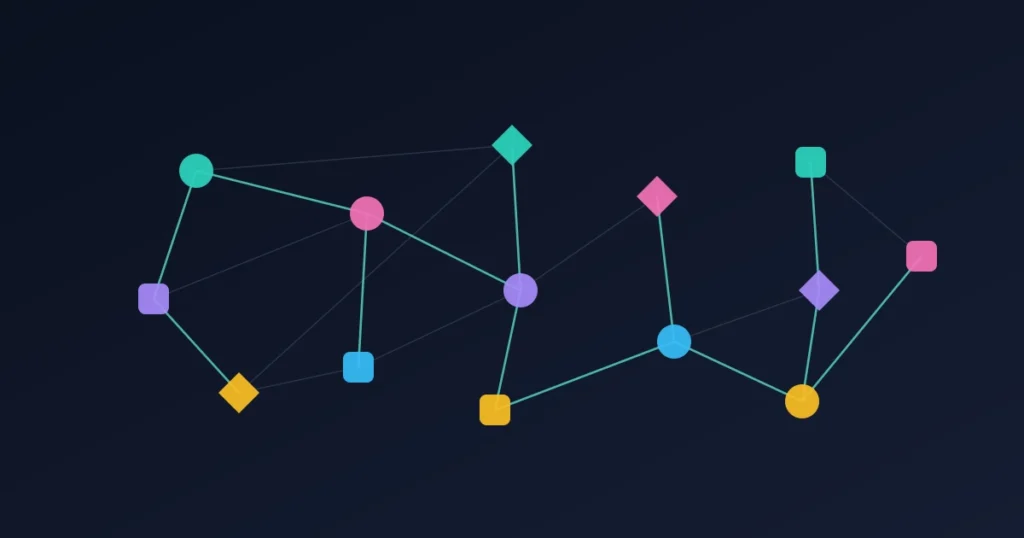
Association rule learning discovers relationships between events that frequently occur together.
Instead of grouping similar observations, it identifies patterns of co-occurrence.
This technique became famous through market basket analysis, where retailers analyse customer purchases to discover which products are commonly bought together.
For example, a supermarket may discover:
| Product Purchased | Frequently Bought Together |
|---|---|
| Bread | Butter |
| Coffee | Sugar |
| Pasta | Tomato Sauce |
| Laptop | Wireless Mouse |
| Smartphone | Protective Case |
These relationships are not manually defined. They are learned automatically from thousands or millions of shopping baskets.
How Association Rules Work
An association rule is commonly written as:
If A occurs, B is likely to occur.
Examples include:
- Bread → Butter
- Coffee → Milk
- Printer → Ink Cartridges
- Running Shoes → Sports Socks
This does not mean one product causes the other. Instead, it indicates that they frequently appear together in historical data.
Key Metrics
Association rules are evaluated using three important measures.
Support
Support measures how frequently an item combination appears in the dataset.
Higher support indicates that the relationship occurs more often.
Confidence
Confidence measures the probability that Product B is purchased when Product A is purchased.
Higher confidence suggests a stronger relationship.
Lift
Lift compares the observed relationship with what would be expected if the products were completely independent.
- Lift > 1 indicates a meaningful association.
- Lift = 1 suggests no relationship.
- Lift < 1 indicates a negative relationship.
Lift helps identify genuinely useful patterns rather than coincidences.
Applications of Association Rule Learning
This technique extends far beyond supermarkets.
It is widely used for:
- Product recommendations
- Cross-selling
- Inventory planning
- Website navigation analysis
- Healthcare diagnosis patterns
- Insurance claim analysis
- Fraud detection
- Cybersecurity event analysis
- Streaming content recommendations
For example, an online retailer may automatically recommend accessories based on products frequently purchased together, increasing average order value.
This concludes the first three major categories of unsupervised learning. In the next part, we’ll cover:
- Anomaly Detection
- Feature Learning and Representation Learning
- Embeddings and Latent Space
- Autoencoders
- How modern AI models like GPT and CLIP learn rich representations from unlabelled data
These sections will bridge classical unsupervised learning with today’s foundation models and make the article significantly more comprehensive than most competing guides.
4. Anomaly Detection
In many machine learning problems, the goal is not to group similar data but to identify observations that are unusual or significantly different from the rest.
This process is known as anomaly detection, sometimes called outlier detection.
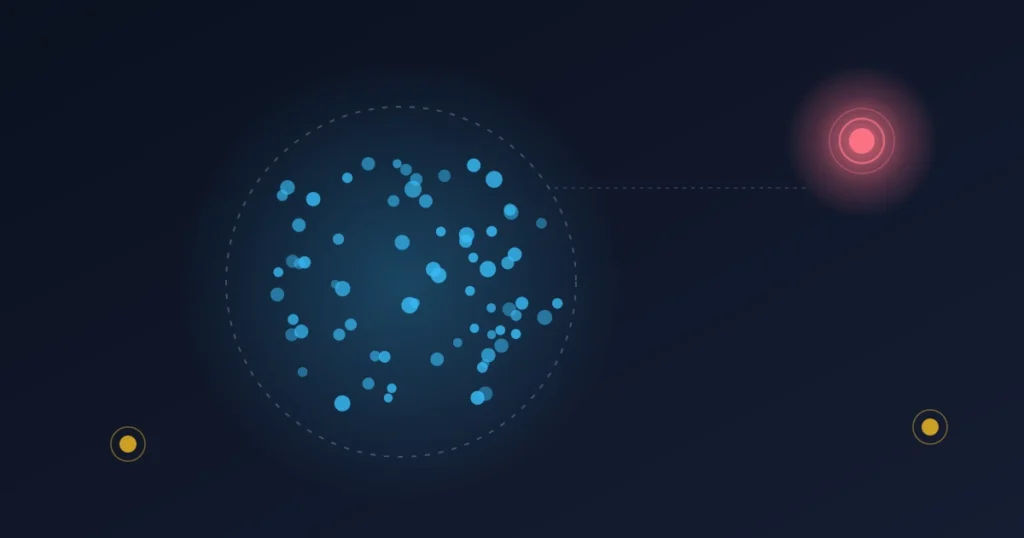
An anomaly is a data point that deviates from normal patterns. It may represent fraud, a cyberattack, faulty equipment, a medical condition, or simply a rare event that deserves further investigation.
Unlike supervised fraud detection, where historical fraud cases are labelled, unsupervised anomaly detection assumes that labels are unavailable. Instead, the algorithm first learns what “normal” behaviour looks like and then flags observations that differ significantly.
Imagine monitoring the daily spending habits of a credit card customer.
Most transactions might look like this:
| Time | Amount | Location |
|---|---|---|
| 8:15 AM | £4.20 | Coffee Shop |
| 1:05 PM | £12.80 | Restaurant |
| 6:30 PM | £38.50 | Supermarket |
Suddenly, a transaction appears:
| Time | Amount | Location |
|---|---|---|
| 2:17 AM | £2,950 | Overseas Electronics Store |
Even without historical fraud labels, this purchase stands out because it differs dramatically from the customer’s normal behaviour.
An anomaly detection algorithm would assign this transaction a high anomaly score, prompting further investigation.
How Anomaly Detection Works
Most anomaly detection algorithms follow three basic steps:
- Learn the characteristics of normal data.
- Measure how different each new observation is from those patterns.
- Flag observations whose differences exceed a chosen threshold.
Depending on the algorithm, “difference” may be measured using:
- Statistical probability
- Distance from neighbouring observations
- Data density
- Reconstruction error
- Isolation depth
Different techniques work better for different types of data.
Common Anomaly Detection Algorithms
Several unsupervised algorithms are widely used in industry.
Isolation Forest
Isolation Forest isolates observations by repeatedly splitting the dataset.
Since anomalies are rare and different from normal observations, they tend to become isolated much faster than regular data points.
Advantages include:
- Fast on large datasets
- Handles high-dimensional data
- Requires minimal preprocessing
- Popular for fraud detection
Local Outlier Factor (LOF)
Rather than examining the entire dataset, LOF compares each observation with its immediate neighbours.
If a point exists in a region with much lower density than nearby observations, it is considered an anomaly.
LOF performs well when datasets contain clusters with different densities.
One-Class Support Vector Machine
One-Class SVM learns the boundary surrounding normal observations.
Any future observation falling outside that boundary is considered abnormal.
Although computationally expensive, it performs well for certain high-dimensional problems.
DBSCAN
Although DBSCAN is primarily known as a clustering algorithm, it naturally identifies anomalies.
Points that do not belong to any dense cluster are labelled as noise, making DBSCAN particularly useful when outliers are expected.
Real-World Applications of Anomaly Detection
Financial Fraud Detection
Banks monitor millions of daily transactions.
Anomaly detection helps identify:
- Credit card fraud
- Insurance fraud
- Money laundering
- Unusual account activity
Rather than relying solely on known fraud patterns, unsupervised models can detect entirely new types of suspicious behaviour.
Cybersecurity
Modern networks generate enormous volumes of activity.
Anomaly detection identifies unusual events such as:
- Unauthorised login attempts
- Malware behaviour
- Insider threats
- Distributed denial-of-service (DDoS) attacks
- Unexpected data transfers
Because attackers continually change their methods, anomaly detection is often more effective than relying only on predefined attack signatures.
Predictive Maintenance
Industrial equipment continuously produces sensor data.
Machine learning can identify:
- Abnormal temperatures
- Excessive vibration
- Pressure fluctuations
- Motor failures
Detecting these anomalies early helps organisations schedule maintenance before costly breakdowns occur.
Healthcare
Medical datasets often contain subtle abnormalities.
Anomaly detection assists with:
- Rare disease identification
- Medical imaging analysis
- Patient monitoring
- Intensive care alerts
- Genetic research
In many cases, these unusual observations become the starting point for new scientific discoveries.
Manufacturing
Factories use anomaly detection to identify:
- Defective products
- Production inconsistencies
- Machine calibration issues
- Assembly line failures
This improves quality control while reducing waste.
Advantages of Anomaly Detection
- Does not require labelled anomalies
- Detects previously unseen problems
- Works in real time
- Improves operational safety
- Supports predictive maintenance
- Reduces financial losses
Challenges
Despite its benefits, anomaly detection is not perfect.
Common challenges include:
- Defining what “normal” behaviour means
- High false-positive rates
- Changing data patterns over time
- Limited evaluation methods
- Computational complexity for massive datasets
As organisations collect more streaming data from IoT devices, cloud systems, and digital platforms, anomaly detection is becoming increasingly important across industries.
5. Feature Learning and Representation Learning
Traditional machine learning depends heavily on manually designed features.
For example, if you wanted to build an email spam detector, you might create features such as:
- Number of hyperlinks
- Percentage of capital letters
- Number of attachments
- Frequency of promotional words
- Sender reputation
These handcrafted features require domain expertise and considerable effort.
Modern AI takes a different approach.
Instead of manually creating useful features, models automatically learn representations directly from raw data.
This process is called feature learning or representation learning.
It has become one of the most influential developments in artificial intelligence over the past decade.
What Is a Representation?
A representation is a mathematical description of data that captures its most useful characteristics.
Consider a photograph of a cat.
The original image may contain millions of pixel values.
To humans, recognising the image is easy.
To a computer, however, it is simply a large collection of numbers.
A representation learning algorithm transforms those raw pixels into a compact numerical representation that captures meaningful information, such as:
- Fur texture
- Ear shape
- Eye position
- Body proportions
- Overall appearance
Rather than memorising every pixel, the model learns the important characteristics that distinguish cats from other objects.
Why Representation Learning Matters
Good representations make many downstream AI tasks easier.
Once meaningful representations have been learned, they can be reused for:
- Classification
- Clustering
- Search
- Recommendation
- Image recognition
- Speech recognition
- Language understanding
- Robotics
This is one reason why foundation models have become so successful.
Instead of training separate models for every task, organisations can first learn powerful representations and then adapt them to many applications.
Embeddings
One of the most important concepts in modern AI is the embedding.
An embedding is a dense numerical vector that represents an object while preserving its semantic meaning.
The object might be:
- A word
- A sentence
- An image
- A video
- A customer
- A product
- A document
- A protein sequence
For example, the words:
- Doctor
- Nurse
- Hospital
would produce embedding vectors that are close together because they are semantically related.
Meanwhile,
- Banana
- Bicycle
would appear much farther apart.
The same principle applies to images, documents, and products.
Similarity becomes a mathematical distance between vectors.
This idea powers:
- Semantic search
- Recommendation engines
- Vector databases
- Image retrieval
- Question-answering systems
- AI assistants
- Retrieval-Augmented Generation (RAG)
Latent Space
Embeddings exist within what researchers call latent space.
Although invisible to humans, latent space is where machine learning organises knowledge.
Objects with similar meanings naturally appear close together.
For example:
Dog -------- Wolf

Cat -------- Lion

Apple ---- Orange

Car ---------------- Bicycle
The actual latent space may contain hundreds or even thousands of dimensions, allowing models to capture highly complex relationships.
When AI systems compare embeddings, they are effectively navigating this latent space to find similar concepts.
Autoencoders
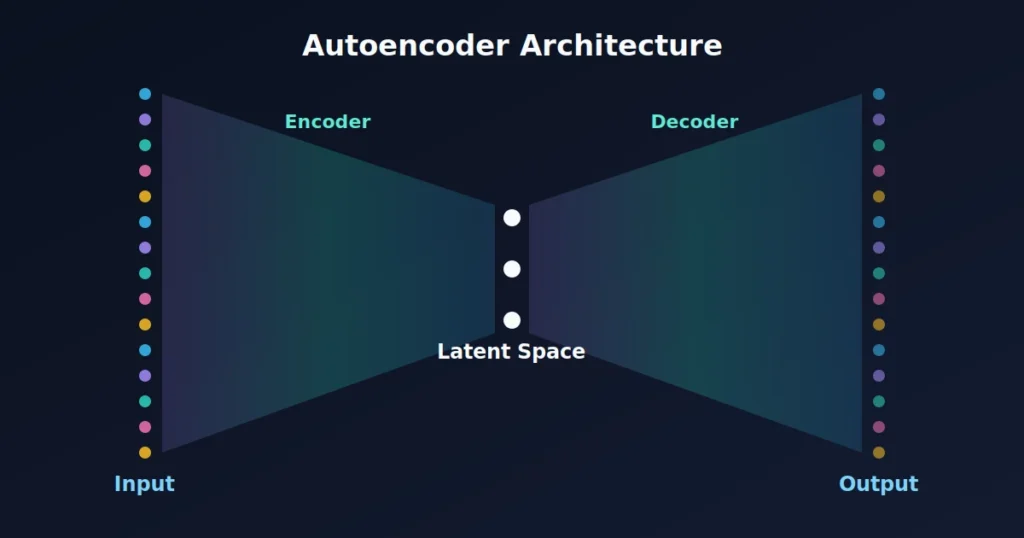
One of the most powerful unsupervised deep learning models is the autoencoder.
An autoencoder is a neural network trained to reconstruct its own input.
At first glance, this may seem like a pointless exercise.
However, the real objective is to force the model to compress the input into a smaller internal representation before rebuilding it.
This compression encourages the network to learn the most important characteristics of the data.
An autoencoder consists of three main components:
Encoder
The encoder transforms the original input into a compact representation.
↓
Latent Space
The compressed representation stores the essential information needed to describe the input.
↓
Decoder
The decoder reconstructs the original input from this compressed representation.
If the reconstruction closely matches the original data, the latent representation has successfully captured meaningful patterns.
Applications of Autoencoders
Autoencoders are widely used for:
- Image denoising
- Data compression
- Feature extraction
- Recommendation systems
- Medical imaging
- Anomaly detection
- Image generation
- Pretraining deep learning models
For anomaly detection, an autoencoder is trained only on normal examples.
When it encounters abnormal data, it struggles to reconstruct it accurately, resulting in a higher reconstruction error that signals a potential anomaly.
From Classical Unsupervised Learning to Modern AI
Classical unsupervised learning focused primarily on tasks such as clustering and dimensionality reduction.
Modern AI has expanded this idea significantly.
Today, large-scale models learn rich representations from enormous collections of unlabelled data before being adapted to specific tasks.
For example:
- Language models learn relationships between words and sentences.
- Vision models learn visual patterns from millions of images.
- Multimodal models connect text, images, audio, and video within a shared representation space.
Although many of these systems use self-supervised learning, they build upon the same fundamental goal as unsupervised learning: extracting meaningful structure from data without relying on extensive manual labelling.
Understanding representation learning provides the bridge between traditional machine learning techniques and today’s advanced AI systems.
Major Unsupervised Learning Algorithms
Different unsupervised learning algorithms are designed to solve different types of problems. Some excel at grouping similar data, while others focus on reducing dimensionality or detecting anomalies. Choosing the right algorithm depends on your dataset, objectives, and computational requirements.
K-Means Clustering
K-Means is one of the most widely used clustering algorithms. It divides data into K clusters by repeatedly assigning data points to the nearest centroid and recalculating the centroid positions until the clusters stabilise.
Best for:
- Customer segmentation
- Product categorisation
- Document clustering
- Image compression
Advantages
- Simple and fast
- Scales well to large datasets
- Easy to implement
Limitations
- Requires the number of clusters (K) in advance
- Sensitive to outliers
- Performs poorly on irregularly shaped clusters
Hierarchical Clustering
Hierarchical clustering builds a tree-like structure called a dendrogram, showing how observations are related at different levels.
It is useful when the number of clusters is unknown and when understanding relationships between groups is important.
Best for:
- Biological classification
- Gene analysis
- Customer segmentation
- Taxonomy creation
DBSCAN (Density-Based Spatial Clustering of Applications with Noise)
DBSCAN groups observations based on density rather than distance.
Unlike K-Means, it can identify clusters of different shapes while automatically treating isolated observations as noise.
Best for:
- Fraud detection
- GPS data
- Geographic analysis
- Network security
- Outlier detection
Gaussian Mixture Models (GMM)
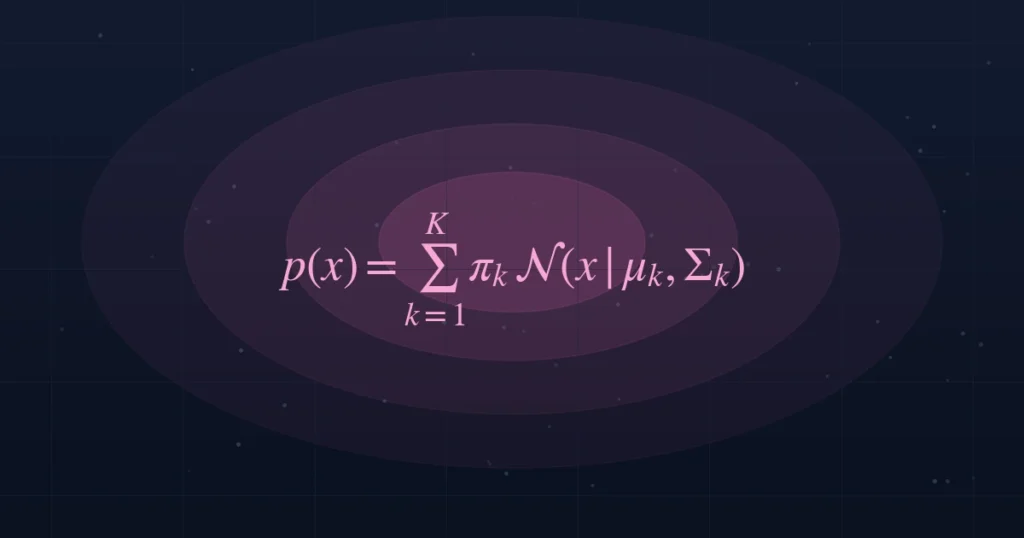
Instead of assigning each observation to a single cluster, GMM estimates the probability that an observation belongs to each cluster.
This allows clusters to overlap naturally.
Best for:
- Image segmentation
- Speech recognition
- Financial modelling
Principal Component Analysis (PCA)
PCA reduces the number of variables while preserving as much information as possible.
It is widely used before applying clustering or visualisation techniques.
Best for:
- Feature reduction
- Data compression
- Machine learning preprocessing
t-SNE
t-SNE projects high-dimensional data into two or three dimensions for visualisation.
Researchers frequently use it to inspect embeddings, customer segments, and gene expression data.
UMAP
UMAP is a modern alternative to t-SNE that generally runs faster and preserves more of the global structure of the data.
It has become increasingly popular for analysing large datasets and visualising embeddings.
Autoencoders
Autoencoders are neural networks that learn compressed representations of data before reconstructing the original input.
They play an important role in modern representation learning and anomaly detection.
Real-World Applications of Unsupervised Learning
Unsupervised learning has become a core technology across many industries because it enables organisations to discover valuable insights without requiring manually labelled datasets.
E-commerce
Retailers use unsupervised learning to:
- Segment customers
- Recommend products
- Personalise marketing campaigns
- Analyse purchasing behaviour
- Optimise pricing strategies
Finance
Banks and financial institutions use unsupervised learning for:
- Fraud detection
- Risk assessment
- Customer segmentation
- Portfolio analysis
- Transaction monitoring
Healthcare
Healthcare organisations apply unsupervised learning to:
- Discover disease subtypes
- Analyse medical images
- Study genetic data
- Detect abnormal patient behaviour
- Support precision medicine
Cybersecurity
Security teams use unsupervised learning to identify:
- Network anomalies
- Malware behaviour
- Insider threats
- Suspicious login attempts
- Zero-day attacks
Manufacturing
Industrial organisations use unsupervised learning for:
- Predictive maintenance
- Quality inspection
- Fault detection
- Sensor monitoring
- Equipment optimisation
Natural Language Processing
In NLP, unsupervised learning powers:
- Topic modelling
- Document clustering
- Semantic search
- Sentence embeddings
- Language representation
Computer Vision
Image-based applications include:
- Face clustering
- Image retrieval
- Medical imaging
- Satellite image analysis
- Object grouping
Advantages of Unsupervised Learning
Unsupervised learning offers several important benefits.
- Works without labelled data
- Reduces the cost of data annotation
- Discovers hidden relationships
- Handles large datasets efficiently
- Supports exploratory data analysis
- Improves feature engineering
- Detects unusual behaviour
- Enables personalised recommendations
- Powers modern AI representations and embeddings
Limitations of Unsupervised Learning
Despite its strengths, unsupervised learning also has limitations.
- No guarantee that discovered clusters are meaningful
- Difficult to evaluate results
- Sensitive to feature scaling
- Different algorithms may produce different outputs
- Choosing hyperparameters can be challenging
- Outliers may significantly affect results
- High-dimensional data increases computational complexity
For these reasons, successful unsupervised learning often combines statistical evaluation with domain expertise.
Unsupervised Learning vs Self-Supervised Learning
Although these terms are often used interchangeably, they are not the same.
| Unsupervised Learning | Self-Supervised Learning |
|---|---|
| Uses completely unlabelled data | Creates labels automatically from the data itself |
| Focuses on clustering, dimensionality reduction and pattern discovery | Focuses on learning rich representations through pretext tasks |
| Traditional machine learning approach | Common in modern deep learning |
| Examples: K-Means, DBSCAN, PCA | Examples: BERT, SimCLR, CLIP, masked language modelling |
Most modern foundation models rely heavily on self-supervised learning because it scales effectively across enormous datasets.
How to Evaluate Unsupervised Learning Models
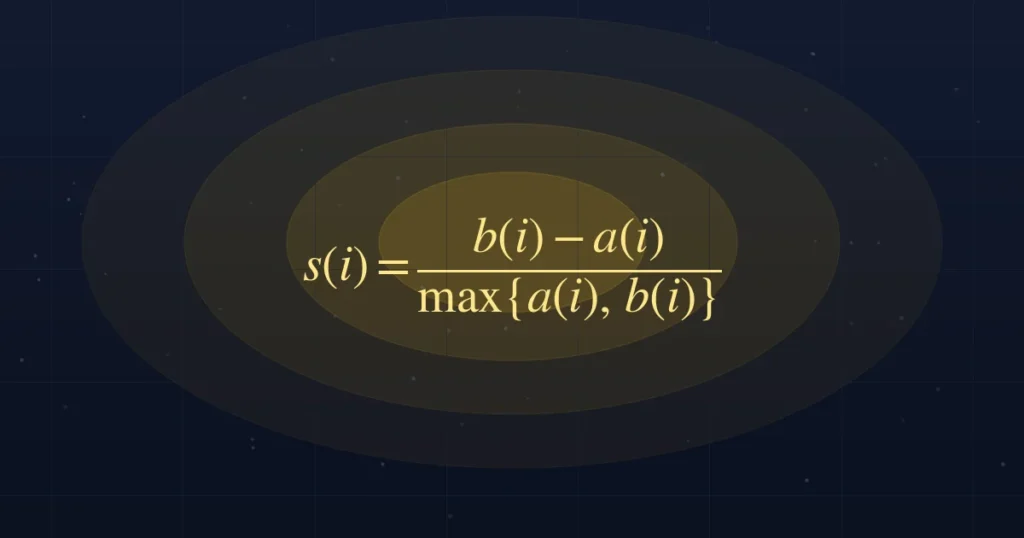
Evaluating unsupervised learning is more challenging than supervised learning because there are usually no ground-truth labels.
Some commonly used evaluation metrics include:
- Silhouette Score – Measures how well observations fit within their assigned clusters.
- Davies-Bouldin Index – Evaluates the similarity between clusters. Lower scores indicate better separation.
- Calinski-Harabasz Index – Measures cluster compactness and separation.
- Adjusted Rand Index (ARI) – Compares clustering results with known labels when they are available.
- Visual inspection – PCA, t-SNE and UMAP help researchers inspect cluster quality visually.
- Business validation – Ultimately, clusters should provide actionable insights that support decision-making.
Common Mistakes to Avoid
When implementing unsupervised learning, avoid these common pitfalls:
- Skipping data preprocessing and feature scaling
- Choosing an inappropriate distance metric
- Selecting the wrong number of clusters
- Ignoring outliers before clustering
- Assuming every dataset naturally contains clusters
- Overinterpreting algorithm outputs without business context
- Using visualisation alone to judge cluster quality
Careful preprocessing and validation are often more important than selecting the latest algorithm.
The Future of Unsupervised Learning
As AI systems continue to evolve, unsupervised learning is becoming even more important.
Future developments are likely to include:
- Better representation learning
- More efficient multimodal AI
- Improved anomaly detection
- Larger foundation models
- Scientific discovery using unlabelled data
- Autonomous robotics
- Edge AI applications
- More scalable clustering for massive datasets
Rather than replacing supervised learning, unsupervised learning will increasingly serve as the foundation for models that learn from vast amounts of raw information before adapting to specific tasks.
1. How to Choose the Right Unsupervised Learning Algorithm
One of the biggest challenges for beginners is deciding which algorithm to use. Since each algorithm is designed for different types of data and objectives, selecting the right one can significantly improve results.
| Goal | Recommended Algorithm | Why It Fits |
|---|---|---|
| Customer segmentation | K-Means | Fast, scalable, easy to interpret |
| Unknown cluster shapes | DBSCAN | Finds irregular clusters and detects outliers |
| Hierarchical relationships | Hierarchical Clustering | Produces dendrograms for detailed analysis |
| Probability-based clustering | Gaussian Mixture Models | Handles overlapping clusters |
| Reduce hundreds of features | PCA | Compresses data while preserving variance |
| Visualise embeddings | UMAP | Preserves local and global relationships |
| Detect anomalies | Isolation Forest | Efficient for large datasets |
| Learn compressed representations | Autoencoders | Excellent for deep learning applications |
2. K-Means vs DBSCAN vs Hierarchical Clustering
This comparison targets several long-tail search queries while helping readers quickly understand the strengths of each algorithm.
| Feature | K-Means | DBSCAN | Hierarchical |
|---|---|---|---|
| Number of clusters required | Yes | No | No |
| Handles outliers | Poorly | Excellent | Moderate |
| Works with irregular shapes | No | Yes | Yes |
| Scalable | Excellent | Good | Moderate |
| Easy to understand | Excellent | Moderate | Good |
| Best use case | Customer segmentation | Fraud detection | Biological classification |
3. PCA vs t-SNE vs UMAP
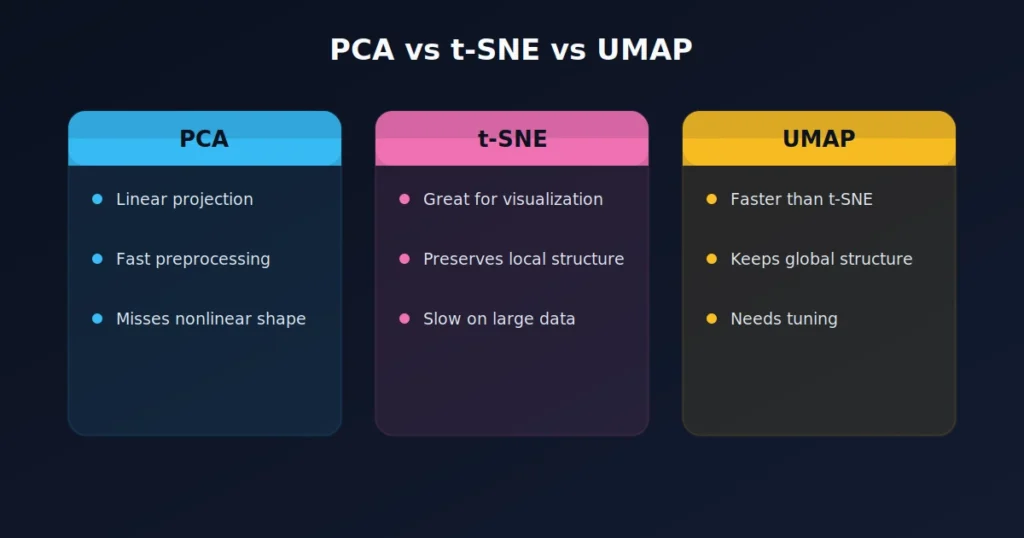
These three techniques are often confused, so a dedicated comparison improves clarity and SEO.
| Technique | Primary Purpose | Best For | Limitations |
|---|---|---|---|
| PCA | Feature reduction | Data preprocessing | Assumes linear relationships |
| t-SNE | Visualisation | Small to medium datasets | Computationally intensive |
| UMAP | Visualisation and embeddings | Large datasets | Requires parameter tuning |
4. Practical Python Example
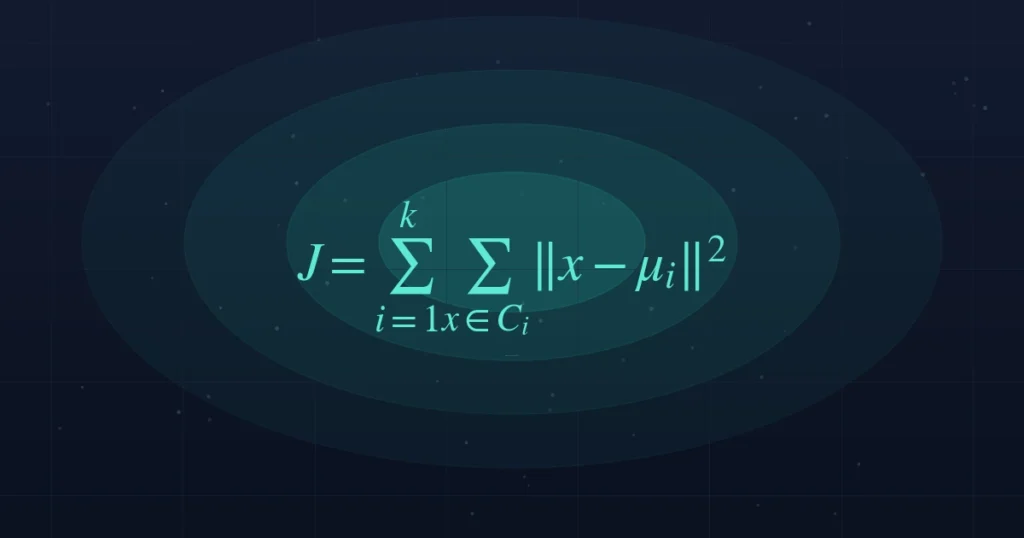
Many readers appreciate seeing how a concept is implemented in code. A simple K-Means example using scikit-learn is a great addition.
from sklearn.cluster import KMeans
from sklearn.datasets import make_blobs
import matplotlib.pyplot as plt

# Create sample data
X, _ = make_blobs(
    n_samples=300,
    centers=4,
    cluster_std=0.60,
    random_state=42
)

# Train the model
model = KMeans(n_clusters=4, random_state=42)
labels = model.fit_predict(X)

# Plot the clusters
plt.scatter(X[:, 0], X[:, 1], c=labels)
plt.scatter(
    model.cluster_centers_[:, 0],
    model.cluster_centers_[:, 1],
    marker="X",
    s=200
)
plt.title("K-Means Clustering")
plt.show()
5. Real-World Case Study
Customer Segmentation for an Online Retailer
Imagine an e-commerce company with one million customers. The business knows each customer’s:
- Purchase history
- Average order value
- Product preferences
- Visit frequency
- Location
However, it has no predefined customer categories.
By applying K-Means clustering, the company identifies five distinct customer segments:
| Segment | Characteristics | Business Action |
|---|---|---|
| Budget Shoppers | Frequent purchases, low spend | Promote discounts and bundles |
| Premium Buyers | High-value purchases | Offer VIP rewards and exclusive products |
| Seasonal Customers | Shop mainly during holidays | Launch seasonal campaigns |
| Loyal Customers | Regular repeat purchases | Introduce loyalty programmes |
| New Customers | Limited purchase history | Send onboarding and welcome offers |
Conclusion
Unsupervised learning is one of the most powerful branches of machine learning because it enables AI systems to discover patterns without relying on manually labelled data.
By identifying hidden relationships, grouping similar observations, reducing data complexity, and detecting anomalies, unsupervised learning transforms raw information into meaningful insights that organisations can use to make better decisions.
Today, its applications extend far beyond traditional clustering. It supports customer segmentation, recommendation systems, fraud detection, predictive maintenance, healthcare research, cybersecurity, natural language processing, and representation learning. Modern AI systems also build on these principles to create embeddings and learn useful representations from enormous collections of unlabelled data.
As the volume of digital information continues to grow, the ability to analyse unlabelled data efficiently will become increasingly valuable. Whether you are building intelligent business applications, conducting scientific research, or developing next-generation AI systems, understanding unsupervised learning provides a strong foundation for exploring the broader field of artificial intelligence.
Frequently Asked Questions
1. What is unsupervised learning?
Unsupervised learning is a type of machine learning that analyses unlabelled data to discover hidden patterns, clusters, or relationships without predefined outputs.
2. What are the main types of unsupervised learning?
The five main types are clustering, dimensionality reduction, association rule learning, anomaly detection, and feature learning.
3. What is the most popular unsupervised learning algorithm?
K-Means is the most widely used algorithm for clustering, while PCA is one of the most common techniques for dimensionality reduction.
4. What is the difference between supervised and unsupervised learning?
Supervised learning uses labelled data to make predictions, whereas unsupervised learning explores unlabelled data to identify patterns and structures.
5. Is ChatGPT trained using unsupervised learning?
Modern large language models primarily use self-supervised learning, which automatically generates training targets from large collections of text. This differs from classical unsupervised learning but shares the goal of learning from data without extensive manual labelling.
6. What industries use unsupervised learning?
Retail, finance, healthcare, cybersecurity, manufacturing, telecommunications, marketing, and scientific research all use unsupervised learning extensively.
7. Why is feature scaling important for clustering?
Many clustering algorithms rely on distance calculations. If features have different scales, variables with larger values can dominate the results, leading to poor-quality clusters.
8. Can unsupervised learning detect fraud?
Yes. By learning normal behaviour and identifying unusual patterns, unsupervised anomaly detection can flag suspicious transactions, even when no historical fraud labels are available.

Sandeep Kumar is the Founder & CEO of Aitude, a leading AI tools, research, and tutorial platform dedicated to empowering learners, researchers, and innovators. Under his leadership, Aitude has become a go-to resource for those seeking the latest in artificial intelligence, machine learning, computer vision, and development strategies.